
This gif perfectly describes the mood of all meteorologists (including myself) who have been watching 99L and the forecast models. Forecasting is a very difficult skill, and usually models make it a little easier on us. Well, that is unless your two most reliable models differ highly in their solutions, change from run to run drastically, and your system that you're monitoring refuses to develop. So, let's try to make sense of everything here.
WARNING FOR NON-METEOROLOGISTS: There will be quite a bit of meteorology in this post, but I will do my best to explain everything as I go.
DISCLAIMER: All models shown are to be used only as guidance. Please do not take any one run of any model and use that as your forecast. They are not exact truth. They will change.
So, let's get to 99L. (Don't worry. Gaston is still out there, but it doesn't have an affect on us.)

So, pop quiz: Where is the center? Answer: there isn't one, or, really, not one that is defined. There was a small circulation that we have been monitoring, and, it's really hard to see it on here, but it may be just north of the eastern tip of Cuba. But, all of this is to say that 99L is extremely disorganized.

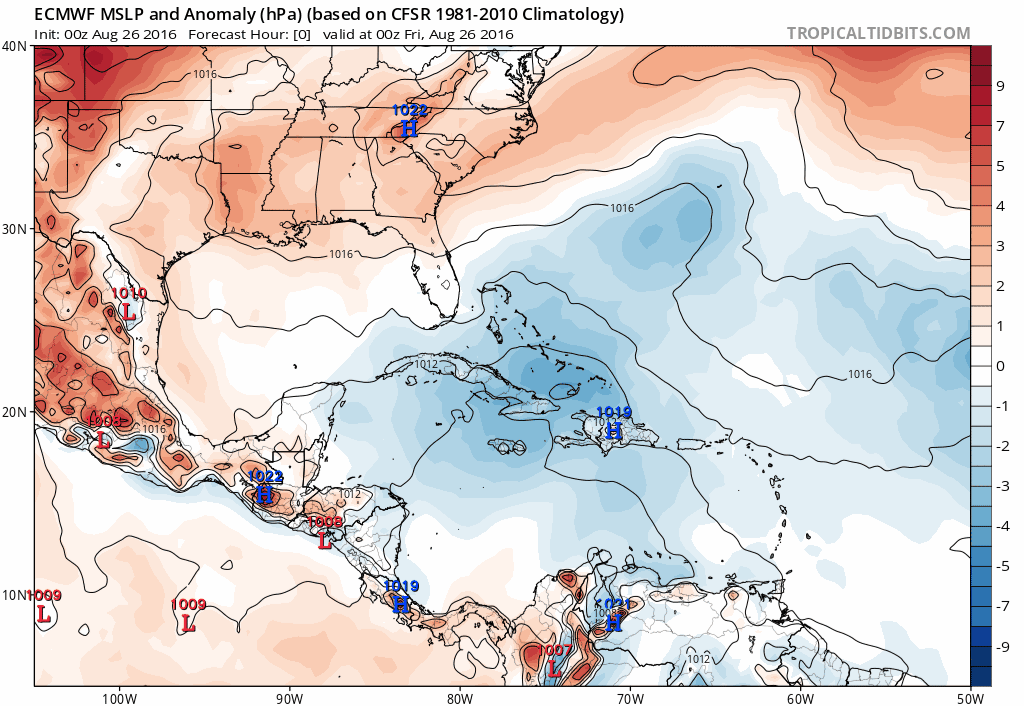
Because of this disorganization, the National Hurricane Center decreased the chances of development to 30% next 2 days and 60% next 5 days. Note, however, that the area for development does now stretch into the southern Gulf of Mexico. Anytime a system works its way into the Gulf, it definitely bears watching.
But what are the conditions ahead of 99L? Good question. We are going to look at 3 things before we talk about the forecast: wind shear, water temperatures, and moisture. First, wind shear.

Wind shear is simply defined as the change of the wind (both speed and direction) with height. Wind shear is helpful for severe weather, but not so much for tropical cyclone formation. Above is a map of the wind shear as of 03Z (10 PM CDT). Note that 99L is now north of the eastern tip of Cuba. It's in a zone of pretty high wind shear (20-30 knots of shear). This is why 99L has pretty much been naked all day. But, 99L is forecast to move between Florida and Cuba, where there is much less shear forecast. This could aid in development. But there are still other factors to consider. Next up, water temperatures.


Above are the sea surface temperature maps for the Caribbean and the Gulf of Mexico. As a general rule of thumb, we typically say that 80°F. (26.7°C) is a good threshold for sustaining or helpful for development of tropical cyclones. On these maps, that is basically anything that is yellow, orange, or red. Absolutely not a problem here. But surface temperature isn't the only thing to focus on, but how deep is that warm water?


These maps show the "depth of the 26°C isotherm." Basically, this shows how deep the water temperature of 79°F. is. The deeper the warm water is, the more energy a tropical cyclone has to thrive on. Between Florida and Cuba, there is a good amount of depth to the warm water. In the Gulf of Mexico, not so much. As a tropical system (or really, any rain for that matter) passes over the water, it cools the surface layer of the water. If you remember back from high school science classes: warm air rises, cold air sinks. Well, the same works with water. As the water cools, it will sink and be replaced by the water underneath it. If the water below is still warm, then it can help support a tropical cyclone. But if the water temperature is too cool, then it may actually help to weaken the system. We see this a lot with tropical cyclones that stall. They will sit over the same part of the water and keep cooling the surface water. Eventually, it runs out of warm water to bring back up to the surface, and the column of water underneath just gets completely cooled. And we need warm warm water to sustain tropical cyclones. Now, one last thing: moisture.


Now, if you're not a meteorologist, you're probably looking at this wondering what in the world it is. This is a skew-T log-p diagram. I won't go into too much detail about what it shows, but heres a quick rundown. The numbers on the left are pressure in millibars (mb). Note that as you go up on the chart (in the atmosphere) the pressure decreases (logarithmically). The numbers on the bottom are temperature in °C. There are thin blue lines that go diagonally up and to the right that represent the temperature every 5 degrees (skewed temperature lines). The seemingly-random lines on the right are the wind speed and direction, but we aren't worth about those. These graphs essentially show a trace of temperature and dew point through the atmosphere. The temperature trace is the right bold line and the dew point is the left bold line. The closer they are, the more moisture there is in that part of the atmosphere, and the farther apart they are, the drier it is. So, these are two diagrams ("soundings") from nearby locations: Santo Domingo, Dominican Republic; and Nassau, Bahamas. Note on the sounding from Nassau that it is pretty dry from about 800 mb and up. Also note on Santo Domingo's sounding the dry layer from about 800 to 650 mb. Tropical cyclones need moisture to help get clouds, showers, and thunderstorms. In this case, we really don't have much of it, which is part of the reason 99L has been struggling.
Okay, now that we got through all of that, let's look at some forecasts.

These are the spaghetti plots for 99L. And, it quite literally looks like a child threw his/her spaghetti all over the map. Each line represents a different model projecting the path of 99L. (If you want to know a bit more about these models, the University of Wisconsin-Milwaukee has an excellent site here.) Right now, the models are quite uncerain about what will happen, though I can summarize their thinking right here: (in general) the models that are taking it further west show a weaker system; the models taking it further north show a slightly stronger system. Now, I've talked about the great debate between the GFS and the ECMWF. Well, things got a bit more interesting (and frustrating) Thursday. Lets start from the 00Z (7 PM CDT) runs of the GFS and the ECMWF from Wednesday night.


Pictured above are the GFS (top) and ECMWF (bottom) runs from Wednesday night going from 7 PM Thursday through 7 PM next Wednesday. You can see that the GFS and ECMWF have similar tracks, but the GFS is considerably weaker than the ECMWF. In fact, the GFS never really developed it, whereas the ECMWF had a landfalling hurricane in the Big Bend. Now, let's take the run 12 hours later from these models.


So this is the 12Z (7 AM CDT) run of the GFS (top) and ECMWF (bottom) for the same timeframe as above (ECMWF is 12 hours later than the GFS since it only goes by 24 hour increments). The GFS brings something west into the Gulf of Mexico, but dissipates it. The ECMWF still shows landfall in the Big Bend, but it's considerably weaker. Still more questions than answers at this time. But, NOAA sent out a couple missions to sample the environment around the system so that we could get a better handle on the conditions 99L could move into. So, let's look at the most recent run of the GFS and ECMWF with that new data put in.

So, which one do we trust? Again, we don't know. Right now, it's a wait and see situation. But, no matter what, you should be prepared for anything with your emergency supply kit. Just make sure you keep up with it. Again, no reason to panic, no reason to worry right now. Just keep an eye on this system.
Again, most of the graphics came from Levi Cowan's site. You can check it out here.
No comments:
Post a Comment