Showing posts with label webcast. Show all posts

Thursday, November 17, 2016

Northwest Florida Weather - 11-17-2016 - Drought Worsens with Little to No Relief


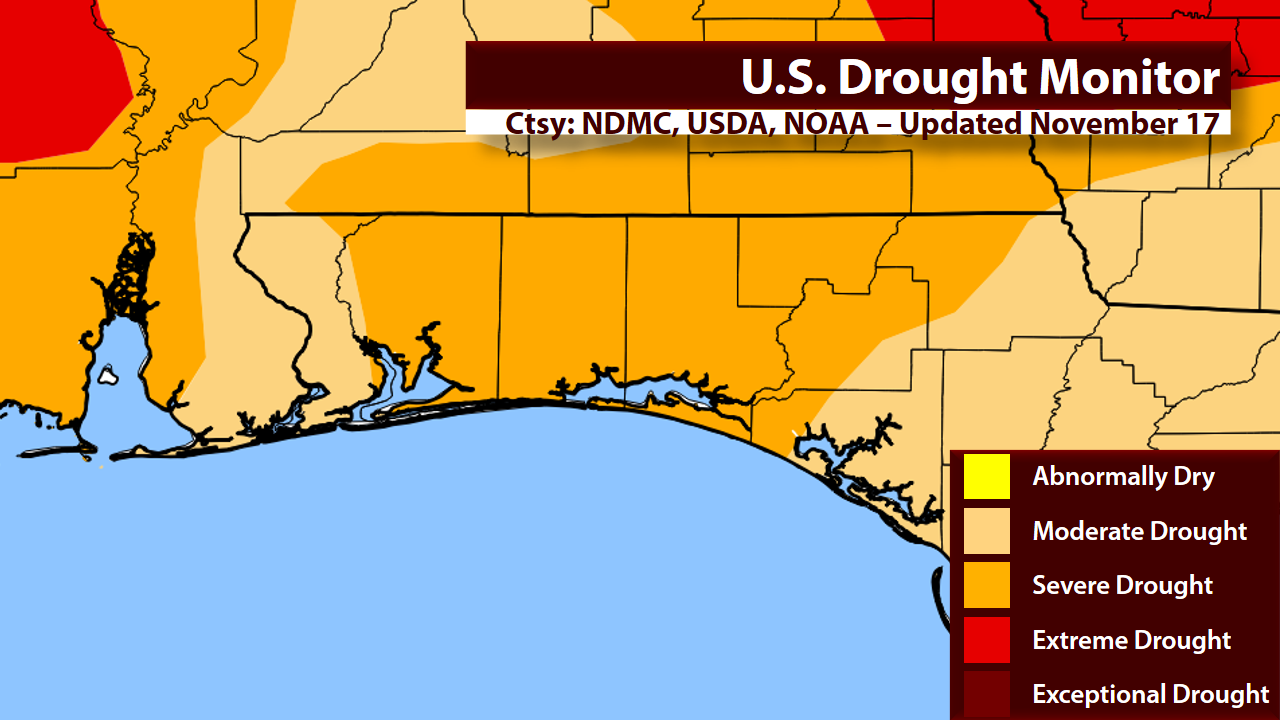
Latest Drought Monitor for Northwest Florida. Map data provided by the National Drought Mitigation Center (NDMC), United States Department of Agriculture (USDA), and the National Oceanic and Atmospheric Administration (NOAA).
The latest drought monitor was released today, and it does not bring good news. Unfortunately, the drought has worsened. Much of Northwest Florida is now in a "Severe Drought." While there are no official burn bans in effect right now, outdoor burning is strongly discouraged. In fact, the Florida Forest Service is not issuing any authorizations for acreage or pile burning in the Blackwater Forestry District (Escambia, Santa Rosa, and Okaloosa Counties). The drought is highly affecting our soil moisture as well.

The Keetch-Byram Drought Index (KBDI) essentially measures the soil moisture. Above is the average value by county across Northwest Florida.
This is the Keetch-Byram Drought Index (KBDI) data from the Florida Forest Service. The KBDI assumes that the top 32 inches of soil can hold up to 8 inches of water. A KBDI of 0 means that the soil is water-logged and can't hold any additional water; on the other hand, A KBDI of 800 means that the soil is completely dry. Right now, Okaloosa, Walton, and Holmes Counties are the driest counties not only in Northwest Florida, but the entire state. This dry soil can lead to an enhanced wildfire danger. Unfortunately, there is very little in the way of rain in the forecast.

12Z (6 AM CST) run of the GFS model. Black solid lines represent isobars (lines of constant pressure). Red and blue dashed lines represent 1000-500 mb thickness. Shaded areas represent 6-hour precipitation accumulation. Fronts drawn in by myself.
While we do have a cold front moving through, it looks like rain will fall apart as it approaches. I am forecasting only a 10% chance of rain, and that might be a bit optimistic. Even if we do see rain, totals will be less than 0.10". Very dry air will follow behind the cold front as well as breezy conditions.

This is a model skew-T from the 12Z (6 AM CST) run of the GFS at KVPS (Destin-Fort Walton Beach Airport). Focus on the upper left diagram. The dashed white diagonal lines are temperatures in degrees Celsius. The solid white horizontal lines are pressure. As you head up the diagram, you go up in the atmosphere, and pressure decreases. The solid red line is the temperature profile through the atmosphere, and the solid green line is the dew point profile through the atmosphere.
Let's look at the above model skew-T. This is valid as of noon CST on Sunday at the Destin-Fort Walton Beach Airport in Valparaiso. It will be rather cool with this particular model only showing mid-50s at the surface at this time. But check out the dew point: 11 degrees Fahrenheit. That is bone-dry. If we go up just a little bit in the atmosphere (roughly 4,500 to 5,000 ft.) at 850 mb, it's even drier. The temperature at 850 mb is 47.3 degrees F., but the dew point is -35.5 degrees F. That is an 82.2 degree difference between the temperature and dew point.

After a bunch of math that I won't bore you with, you get this:
Relative humidity at the surface: 16.4%
Relative humidity at 850 mb: 2.2%

In other words, very, very dry conditions are expected after the cold front passes through. That coupled with winds around 10 mph could produce very dangerous conditions for wildfires. Fire Weather Watches or Red Flag Warnings may become necessary.

But that's not the only threat. Some of the coldest air of the season so far will be filtering in behind this front. Many areas could see their first freeze of the season. Here is a look at Saturday Night's forecast:


This already would be the coldest air of the season for most areas. Widespread 30s can be expected across much of Northwest Florida. But, the winds will prevent the temperatures from falling below freezing for most places. Now, not to outdo Saturday night, here's Sunday Night's forecast:


Even colder temperatures possible on Sunday night. With decreasing winds, it will allow our temperatures to fall quite a bit more. Many areas north of the bays could see their first freeze of the season. The National Weather Service in Mobile (which covers Escambia, Santa Rosa, and Okaloosa Counties) said this in their latest forecast discussion:

It will then be dry and cold over the weekend in the wake of the front and surface high
pressure building in from the north. Will monitor for likley [sic] Freeze
Watches and Warnings over the weekend...
Low temperatures Saturday night behind the cold front will fall into
the mid to upper 30s, with lows Sunday night ranging from 25 to 32
degrees inland areas, and from 32 to 38 degrees along the immediate
coast.
So, in summary, very little, if any, rain is expected through the weekend. A cold front will move through on Saturday, which will bring the coldest air of the season. Freeze Watches/Warnings will likely be issued this weekend. Very dry air and breezy conditions this weekend will lead to dangerous wildfire conditions, and Fire Weather Watches/Red Flag Warnings may be required.

Thursday, November 3, 2016

NW FL Weather (11-3-2016) - Some Cooler Weather, but What About Rain?

Here's the latest webcast for Northwest Florida as of 4:45 PM, November 3, 2016. Discussion follows below:


I know that some of you are tired of the heat, and some of you are embracing it. Either way, "What goes up must come down." Temperatures will finally be settling back to being more fall-like. We won't be frigid, but it will be rather cool compared to what we had lately. But, what about our rain situation?

Across Northwest Florida, the last day of measurable rain for most of us was back in late September. In fact, Pensacola has had 37 days (as of Nov. 3) without measurable precipitation. The record for longest streak of no measurable precipitation for Pensacola is 49 days set back in 1952. It's uncertain if that record will hold.

In the webcast, I mentioned some "model uncertainty" as we head into next week. Here's a bit of what I mean.

First, we're going to take a look at the mid to upper levels of the atmosphere (500 mb, or about 17,000 ft.).


This is the GFS model out 168 hours representing what the atmosphere could look like at 7 AM Nov. 10. The shaded colors on the map represent the 500 mb heights and the black lines are the surface pressure (isobars). Generally, the lower the heights, the colder the temperatures are aloft. On this map, there is a cut-off low over the Central Plains. It is cut-off from the main flow which is to the north (where the tighter color gradient is. This gives us a southwesterly flow leading to more moisture flowing in. The increased moisture generally leads to higher rain chances. Also, there is an inverted surface trough seen in the isobar pattern over the lower and mid Mississippi River Valley. This could help produce some lift, which, again, could lead to higher rain chances.


Now, contrast the GFS to the European (ECMWF) model. This is the same map as above, just a different model. Notice, instead of a cut-off low over the Central Plains, there is generally a ridge. There is a weak cut-off low over New Mexico, Arizona, and northern Mexico. There is also a trough off the east coast, which is where the cut-off low essentially originated. The trough, basically, split into two parts, and the connection between the trough and the cut-off low weakened. In theory, this weakens any front that would come through our area. Thus, probably not a good chance of rain from this scenario. Plus, the cut-off low is too far west to give us any good influence from the Gulf of Mexico.

Unfortunately, this disparity between the models leads to very low confidence in longer term, and I do not feel like it would be wise to advertise anything greater than a 30% chance of rain next week.

Now, there are more models out there, but the GFS and the ECMWF are generally the most reliable. Both have their strengths and their weaknesses. Also, this is just one variable of the many that we could look at. The 500 mb heights is, in my opinion, the best to look at for the overall pattern. However, it is important to focus on not just one run, but the trend that the models show.  The models have consistently shown a change in the overall pattern which would allow some cooler air and possibly higher rain chances than what we've had. The GFS, in this case, is on the stronger side, and the ECMWF is on the weaker side. There is still plenty of time to watch this system over the several days to see how it evolves. I will keep you updated through these blogs and through webcasts.